前言 在上一系列文章我们讲了线性回归的相关知识,回归和分类是机器学习中两种核心的任务类型,它们的根本区别在于目标变量的性质。回归任务 旨在预测一个连续的数值输出,例如预测房价、温度或销售额等,其目标是建立一个模型来拟合输入特征与连续目标值之间的关系。而分类任务 则是预测离散的类别标签,比如判断邮件是否为垃圾邮件、图像中的人物身份,或者是疾病诊断等,其目的是通过模型将输入数据划分到预定义的类别中。本系列文章主要来讲讲如何应用逻辑回归来对数据进行分类。
一、基础理论部分 逻辑回归(Logistic Regression)是一种广泛应用于二分类问题的统计学习方法,通过将系数与自变量的线性计算结果输入到sigmoid函数中,得到概率预测值,从而达到分类的效果。
1.1 sigmoid函数 在逻辑回归中,Sigmoid函数用于将线性组合的输出映射到(0, 1)区间,从而将问题转化为概率预测问题
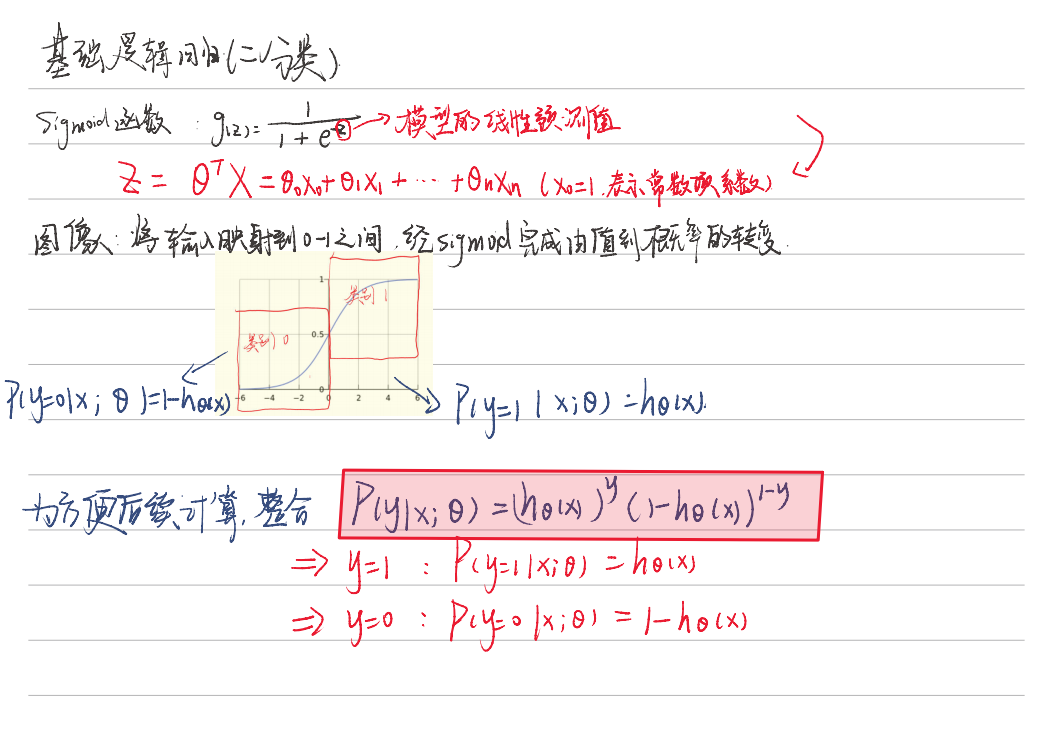
下面是一个对Sigmoid函数解释以及逻辑回归的预测函数推导
这里值得注意的是sigmoid函数的输入部分,笔记里写的是线性预测值,实际上是线性计算值 ,意思是并非线性回归得到的参数,这里的参数theta是基于逻辑回归的梯度下降法优化得到的,而非最小二乘法
1.2 梯度下降 类比最小二乘法,这里我们为了更好的描述模型的概率分布,引入似然函数,通过最大化似然函数来优化模型参数theta,简单公式推导如下,这里也省略了推导过程,因为我们只需要结论
这里通过引入梯度上升
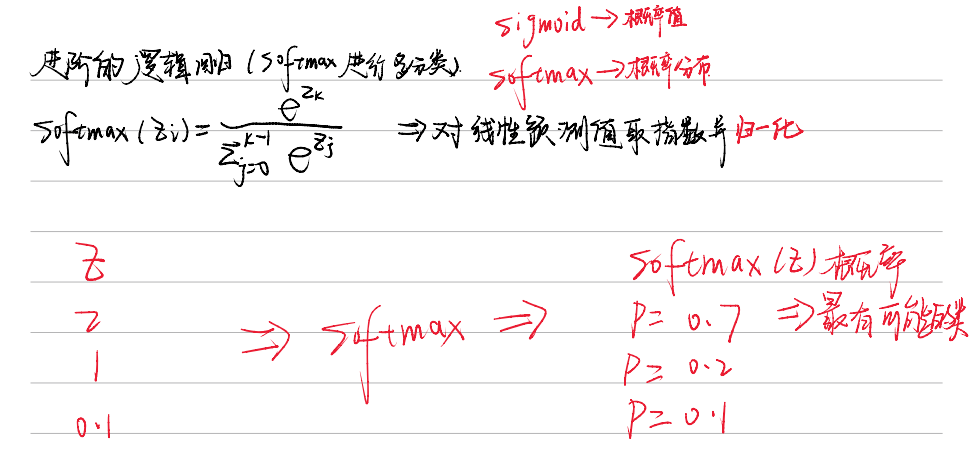
1.3 softmax函数 softmax函数是一种在机器学习和深度学习中常用的激活函数,特别是在处理多分类问题时。它将一个向量或一组实数转换为一个概率分布,将模型的输出转换为概率预测。使得每个元素的值都在0到1之间,并且所有元素的和为1。
softmax公式:
对于softmax函数,我们仍然需要 通过最大似然函数来求得最优参数,交叉熵相当于多分类任务目标损失函数 ,也是我们的梯度下降目标,简单了解就行公式定义如下
这个公式计算了模型预测的概率分布与真实标签之间的差异,目标是通过优化参数 θ 来最小化这个损失。
理论部分比较简单,只要知道二分类使用sigmoid函数,多分类使用softmax函数,以及整个分类的流程即可
二、sklearn代码复现 逻辑回归的基本形式是使用一个线性函数来预测事件发生的概率,然后通过一个非线性的激活函数(Sigmoid函数)将线性函数的输出映射到0和1之间的概率值。因此对于非线性的数据,我们也可以通过变换来将他转变为线性数据。
2.1 初始化 1 2 3 4 5 6 7 8 9 10 11 12 13 14 15 16 17 18 19 20 21 22 23 24 25 26 27 28 29 30 31 32 33 34 35 36 37 38 import numpy as npfrom scipy.optimize import minimizefrom utils.features import prepare_for_trainingfrom utils.hypothesis import sigmoidclass LogisticRegression : def __init__ (self, data, labels, polynomial_degree=0 , sinusoid_degree=0 , normalize_data=True ): """ 1.对数据预处理 2.得到所有特征个数 3.得到初始化参数矩阵 """ (data_processed, features_mean, features_deviation) = prepare_for_training(data, polynomial_degree, sinusoid_degree, normalize_data=False ) self .data = data_processed self .labels = labels self .unique_labels = np.unique(labels) self .features_mean = features_mean self .features_deviation = features_deviation self .polynomial_degree = polynomial_degree self .sinusoid_degree = sinusoid_degree self .normalize_data = normalize_data num_features = self .data.shape[1 ] num_unique_labels = np.unique(labels).shape[0 ] self .theta = np.zeros((num_unique_labels, num_features))
初始化了一些变量,这里unique_labels代表在数据中一共要分为几个类别,theta参数的个数由数据的特征数决定
2.2 train()模块 1 2 3 4 5 6 7 8 9 10 11 12 13 14 15 16 17 18 19 20 21 22 23 24 25 26 27 28 29 30 31 32 33 34 35 36 37 38 39 40 41 42 43 44 45 46 47 48 49 50 51 52 53 54 55 56 57 58 59 60 61 62 63 64 65 66 67 68 69 70 71 72 73 74 75 76 77 78 79 80 81 82 83 84 85 86 87 88 89 @staticmethod def hypothesis (data, theta ): prob = sigmoid(np.dot(data, theta)) return prob @staticmethod def cost_function (data, labels, theta ): num_examples = data.shape[0 ] predictions = LogisticRegression.hypothesis(data, theta) y_is_set_cost = np.dot(labels[labels == 1 ].T, np.log(predictions[labels == 1 ])) y_is_not_set_cost = np.dot(1 - labels[labels == 0 ].T, np.log(1 - predictions[labels == 0 ])) cost = (-1 / num_examples) * (y_is_set_cost + y_is_not_set_cost) return cost @staticmethod def gradient_step (data, labels, theta ): num_examples = labels.shape[0 ] predictions = LogisticRegression.hypothesis(data, theta) label_diff = predictions - labels gradients = (1 / num_examples) * np.dot(data.T, label_diff) return gradients.T.flatten() @staticmethod def gradient_descent (data, labels, current_initial_theta, max_iterations ): """ from scipy.optimize import minimize result = minimize( fun, # 目标函数 x0, # 初始参数 args=(), # 传递给目标函数的额外参数 method=None, # 优化方法 jac=None, # 目标函数的梯度(可选) hess=None, # 目标函数的Hessian矩阵(可选) constraints=(), # 约束条件(可选) callback=None, # 每次迭代的回调函数(可选) options=None # 优化选项(如最大迭代次数等) ) """ cost_history = [] num_features = data.shape[1 ] result = minimize( lambda current_theta: LogisticRegression.cost_function(data, labels, current_theta.reshape(num_features, 1 )), current_initial_theta.flatten(), method='CG' , jac=lambda current_theta: LogisticRegression.gradient_step(data, labels, current_theta.reshape(num_features, 1 )), callback=lambda current_theta: cost_history.append( LogisticRegression.cost_function(data, labels, current_theta.reshape((num_features, 1 )))), options={'maxiter' : max_iterations} ) if not result.success: raise ArithmeticError('Can not minimize cost function' + result.message) optimized_theta = result.x.reshape(num_features, 1 ) return optimized_theta, cost_history def train (self, max_iterations=1000 ): cost_histories = [] num_features = self .data.shape[1 ] for label_index, unique_label in enumerate (self .unique_labels): current_initial_theta = np.copy(self .theta[label_index].reshape(num_features, 1 )) current_lables = (self .labels == unique_label).astype(float ) (current_theta, cost_history) = LogisticRegression.gradient_descent(self .data, current_lables, current_initial_theta, max_iterations) self .theta[label_index] = current_theta.T cost_histories.append(cost_history) return self .theta, cost_histories
注意在这里使用了一个**minimize,**通常指的是找到一个函数的最小值或最小化某个目标函数的过程。这个过程是许多算法的核心,尤其是在训练模型时,目标是通过调整模型参数来最小化损失函数(或代价函数)
2.3 预测模块 1 2 3 4 5 6 7 8 9 10 11 12 13 14 15 16 def predict (self, data ): num_examples = data.shape[0 ] data_processed = prepare_for_training(data, self .polynomial_degree, self .sinusoid_degree, self .normalize_data)[ 0 ] prob = LogisticRegression.hypothesis(data_processed, self .theta.T) max_prob_index = np.argmax(prob, axis=1 ) class_prediction = np.empty(max_prob_index.shape, dtype=object ) for index, label in enumerate (self .unique_labels): class_prediction[max_prob_index == index] = label return class_prediction.reshape((num_examples, 1 ))
可以看到逻辑回归的代码结构和之前我懵线性回归基本相同,需要改变的部分只有梯度下降部分函数以及预测方式
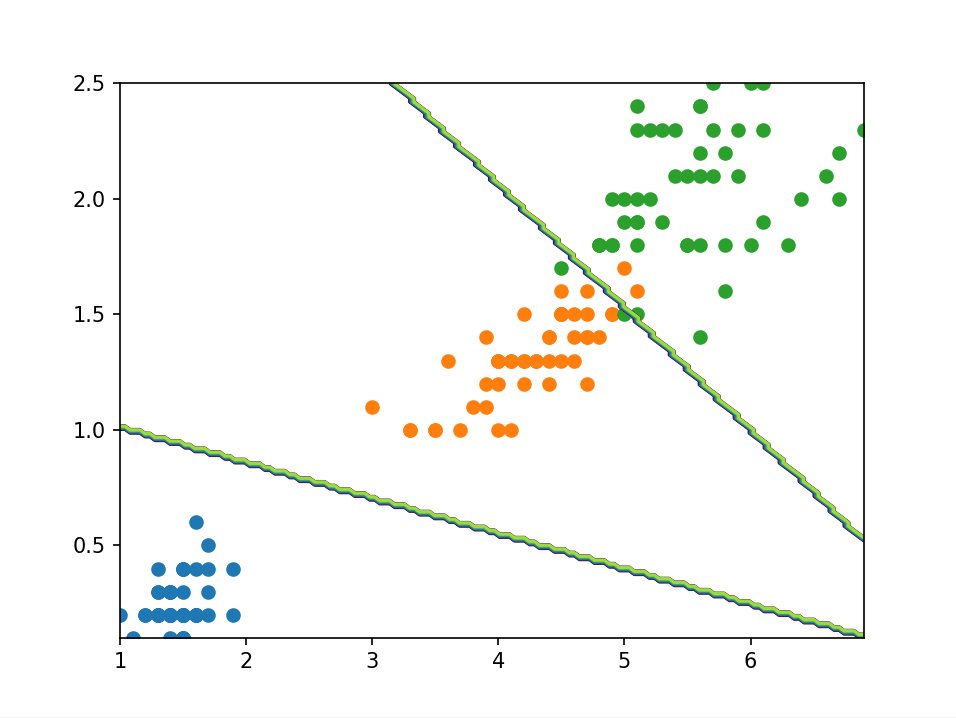
2.4 线性数据测试 这里选用鸢尾花数据集来带入模型进行二分类,在分类中结果的可视化中,通常绘制决策边界来可视化分类效果,前面也提到过分类模型的评估指标,这里不再重复叙述
1 2 3 4 5 6 7 8 9 10 11 12 13 14 15 16 17 18 19 20 21 22 23 24 25 26 27 28 29 30 31 32 33 34 35 36 37 38 39 40 41 42 43 44 45 46 47 48 49 50 51 52 53 54 55 56 57 58 59 60 61 62 63 64 65 66 67 68 69 70 71 72 73 74 75 76 77 import numpy as npimport pandas as pdimport matplotlib.pyplot as pltimport matplotlibmatplotlib.use('TkAgg' ) from logistic_regression import LogisticRegressiondata = pd.read_csv(r'data\iris.csv' ) iris_types = ['SETOSA' , 'VERSICOLOR' , 'VIRGINICA' ] x_axis = 'petal_length' y_axis = 'petal_width' for iris_type in iris_types: plt.scatter(data[x_axis][data['class' ] == iris_type], data[y_axis][data['class' ] == iris_type], label=iris_type ) plt.show() num_examples = data.shape[0 ] x_train = data[[x_axis, y_axis]].values.reshape((num_examples, 2 )) y_train = data['class' ].values.reshape((num_examples, 1 )) max_iterations = 1000 polynomial_degree = 0 sinusoid_degree = 0 logistic_regression = LogisticRegression(x_train, y_train, polynomial_degree, sinusoid_degree) thetas, cost_histories = logistic_regression.train(max_iterations) labels = logistic_regression.unique_labels plt.plot(range (len (cost_histories[0 ])), cost_histories[0 ], label=labels[0 ]) plt.plot(range (len (cost_histories[1 ])), cost_histories[1 ], label=labels[1 ]) plt.plot(range (len (cost_histories[2 ])), cost_histories[2 ], label=labels[2 ]) plt.show() y_train_prections = logistic_regression.predict(x_train) precision = np.sum (y_train_prections == y_train) / y_train.shape[0 ] * 100 print ('precision:' , precision)x_min = np.min (x_train[:, 0 ]) x_max = np.max (x_train[:, 0 ]) y_min = np.min (x_train[:, 1 ]) y_max = np.max (x_train[:, 1 ]) samples = 150 X = np.linspace(x_min, x_max, samples) Y = np.linspace(y_min, y_max, samples) Z_SETOSA = np.zeros((samples, samples)) Z_VERSICOLOR = np.zeros((samples, samples)) Z_VIRGINICA = np.zeros((samples, samples)) for x_index, x in enumerate (X): for y_index, y in enumerate (Y): data = np.array([[x, y]]) prediction = logistic_regression.predict(data)[0 ][0 ] if prediction == 'SETOSA' : Z_SETOSA[x_index][y_index] = 1 elif prediction == 'VERSICOLOR' : Z_VERSICOLOR[x_index][y_index] = 1 elif prediction == 'VIRGINICA' : Z_VIRGINICA[x_index][y_index] = 1 for iris_type in iris_types: plt.scatter( x_train[(y_train == iris_type).flatten(), 0 ], x_train[(y_train == iris_type).flatten(), 1 ], label=iris_type ) plt.contour(X, Y, Z_SETOSA) plt.contour(X, Y, Z_VERSICOLOR) plt.contour(X, Y, Z_VIRGINICA) plt.show()
简单展示一下决策边界
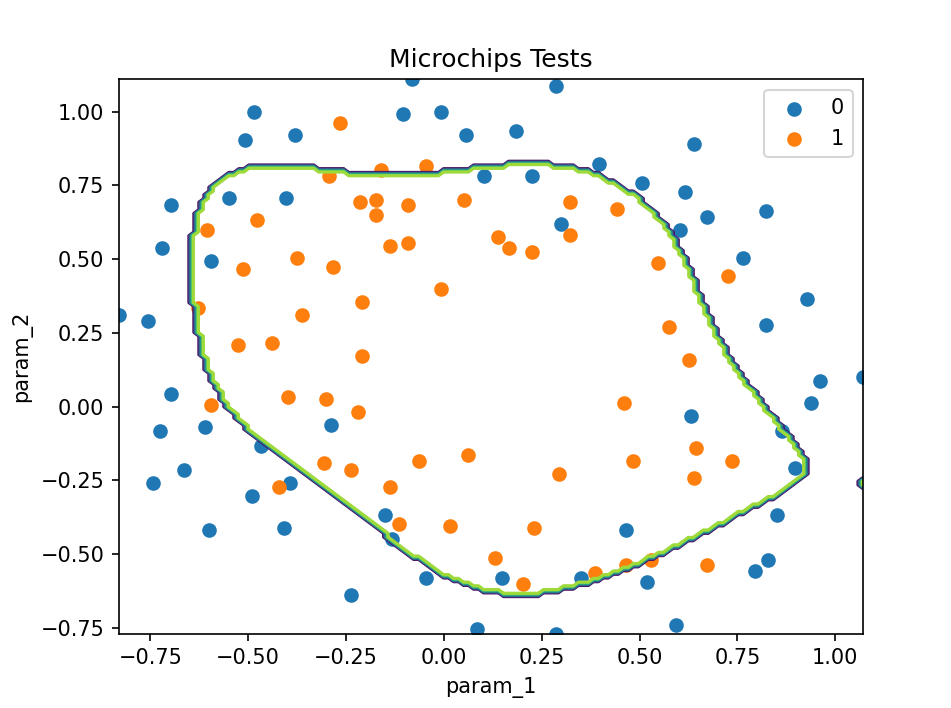
2.5 非线性数据测试
引入非线性数据进行非线性变换后,模型的分类会更加灵活
1 2 3 4 5 6 7 8 9 10 11 12 13 14 15 16 17 18 19 20 21 22 23 24 25 26 27 28 29 30 31 32 33 34 35 36 37 38 39 40 41 42 43 44 45 46 47 48 49 50 51 52 53 54 55 56 57 58 59 60 61 62 63 64 65 66 67 68 69 70 71 72 73 74 75 76 77 78 79 80 81 82 83 84 85 86 87 88 89 90 91 92 93 94 95 96 97 98 99 100 101 import numpy as npimport pandas as pdimport matplotlib.pyplot as pltimport matplotlibmatplotlib.use('TkAgg' ) from logistic_regression import LogisticRegressiondata = pd.read_csv(r'D:\桌面\华清\机器学习\西瓜书\逻辑回归\data\microchips-tests.csv' ) validities = [0 , 1 ] x_axis = 'param_1' y_axis = 'param_2' for validity in validities: plt.scatter( data[x_axis][data['validity' ] == validity], data[y_axis][data['validity' ] == validity], label=validity ) plt.xlabel(x_axis) plt.ylabel(y_axis) plt.title('Microchips Tests' ) plt.legend() plt.show() num_examples = data.shape[0 ] x_train = data[[x_axis, y_axis]].values.reshape((num_examples, 2 )) y_train = data['validity' ].values.reshape((num_examples, 1 )) max_iterations = 100000 regularization_param = 0 polynomial_degree = 5 sinusoid_degree = 2 logistic_regression = LogisticRegression(x_train, y_train, polynomial_degree, sinusoid_degree) (thetas, costs) = logistic_regression.train(max_iterations) columns = [] for theta_index in range (0 , thetas.shape[1 ]): columns.append('Theta ' + str (theta_index)); labels = logistic_regression.unique_labels plt.plot(range (len (costs[0 ])), costs[0 ], label=labels[0 ]) plt.plot(range (len (costs[1 ])), costs[1 ], label=labels[1 ]) plt.xlabel('Gradient Steps' ) plt.ylabel('Cost' ) plt.legend() plt.show() y_train_predictions = logistic_regression.predict(x_train) precision = np.sum (y_train_predictions == y_train) / y_train.shape[0 ] * 100 print ('Training Precision: {:5.4f}%' .format (precision))num_examples = x_train.shape[0 ] samples = 150 x_min = np.min (x_train[:, 0 ]) x_max = np.max (x_train[:, 0 ]) y_min = np.min (x_train[:, 1 ]) y_max = np.max (x_train[:, 1 ]) X = np.linspace(x_min, x_max, samples) Y = np.linspace(y_min, y_max, samples) Z = np.zeros((samples, samples)) for x_index, x in enumerate (X): for y_index, y in enumerate (Y): data = np.array([[x, y]]) Z[x_index][y_index] = logistic_regression.predict(data)[0 ][0 ] positives = (y_train == 1 ).flatten() negatives = (y_train == 0 ).flatten() plt.scatter(x_train[negatives, 0 ], x_train[negatives, 1 ], label='0' ) plt.scatter(x_train[positives, 0 ], x_train[positives, 1 ], label='1' ) plt.contour(X, Y, Z) plt.xlabel('param_1' ) plt.ylabel('param_2' ) plt.title('Microchips Tests' ) plt.legend() plt.show()
三、机器学习LogisticRegression库 在sklearn库中使用LogisticRegression进行逻辑回归比较简单,接下来我们将一一进行演示,并且引入多分类。
3.1 二分类 首先导入鸢尾花数据集,并将转换分类标签数目为2,方便后续二分类操作。
1 2 3 4 5 6 7 from sklearn.datasets import load_irisiris = load_iris() x = iris["data" ][:,3 :] y = (iris["target" ] == 2 ).astype(int ) y
调用LogisticRegression进行回归
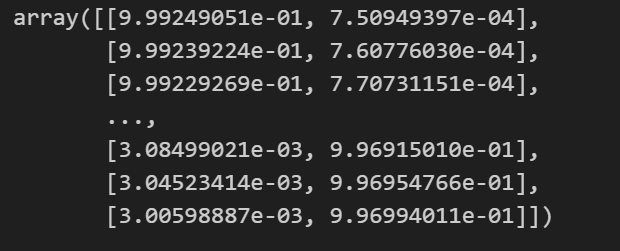
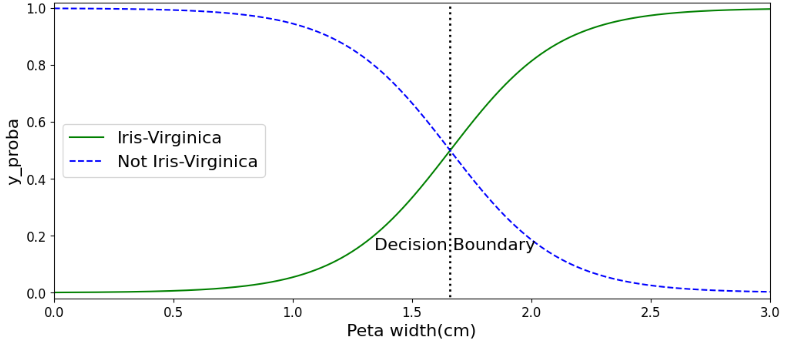
1 2 3 4 5 6 7 8 9 10 from sklearn.linear_model import LogisticRegressionlog_res = LogisticRegression() log_res.fit(x,y) 生成新的数据作为预测输入 x_new = np.linspace(0 ,3 ,1000 ).reshape(-1 ,1 ) y_proba = log_res.predict_proba(x_new) y_proba
注意这里二分类的概率值有两列,表示模型对输入数据的预测概率,即每个样本属于每个类别的概率,我们可以可视化一下概率情况,不难理解,样本属于A类的概率越大,属于B类的概率就越小
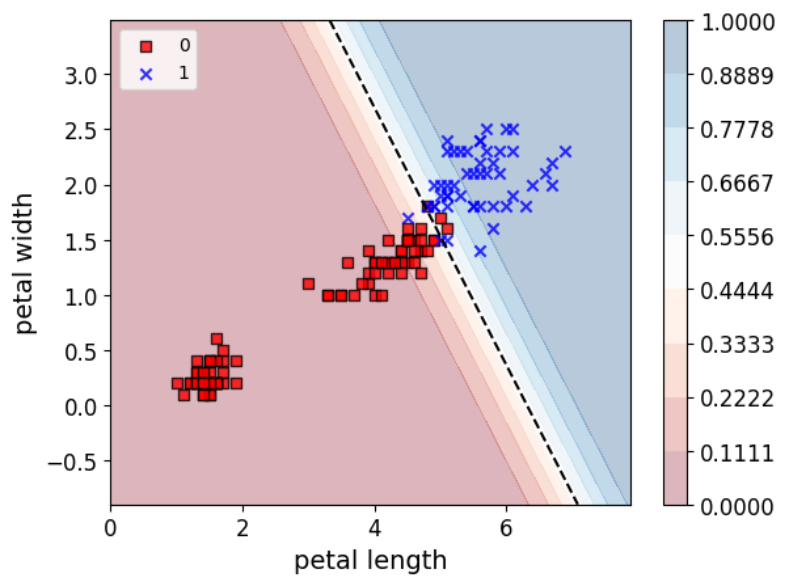
决策边界 的本质是模型根据输入特征进行分类的分界线 。对于给定的输入数据,决策边界将特征空间划分为不同的区域,每个区域对应一个类别 。模型会根据数据点落在哪个区域来预测其类别 。
下面我们来看看如何绘制**决策边界,**不用背代码,只需要知道套用到自己的模型时怎么更改参数就行了
1 2 3 4 5 6 7 8 9 10 11 12 13 14 15 16 17 18 19 20 21 22 23 24 25 26 27 28 29 30 31 32 33 34 35 36 37 38 39 40 41 42 43 44 45 46 47 48 49 50 51 52 53 x = iris["data" ][:,(2 ,3 )] y = (iris["target" ]==2 ).astype(np.int_) from sklearn.linear_model import LogisticRegressionlog_res = LogisticRegression() log_res.fit(x,y) import matplotlib.pyplot as plt%matplotlib inline from matplotlib.colors import ListedColormapimport numpy as npdef plot_decision_region (X, y, classifier, resolution=0.02 ): markers = ('s' , 'x' , 'o' , '^' , 'v' ) colors = ('red' , 'blue' , 'lightgreen' , 'gray' , 'cyan' ) cmap = ListedColormap(colors[:len (np.unique(y))]) x1_min, x1_max = X[:, 0 ].min () - 1 , X[:, 0 ].max () + 1 x2_min, x2_max = X[:, 1 ].min () - 1 , X[:, 1 ].max () + 1 xx1, xx2 = np.meshgrid(np.arange(x1_min, x1_max, resolution), np.arange(x2_min, x2_max, resolution)) Z = classifier.predict_proba(np.array([xx1.ravel(), xx2.ravel()]).T)[:, 1 ] Z = Z.reshape(xx1.shape) plt.contourf(xx1, xx2, Z, alpha=0.3 , cmap=plt.cm.RdBu, levels=np.linspace(Z.min (), Z.max (), 10 )) plt.colorbar() plt.contour(xx1, xx2, Z, levels=[0.5 ], colors='k' , linestyles='--' ) for idx, cl in enumerate (np.unique(y)): plt.scatter(x=X[y == cl, 0 ], y=X[y == cl, 1 ], alpha=0.8 , c=colors[idx], marker=markers[idx], label=cl, edgecolors='black' ) plt.xlabel('petal length' ) plt.ylabel('petal width' ) plt.legend(loc='upper left' ) plt.show() plot_decision_region(x, y, classifier=log_res, resolution=0.01 )
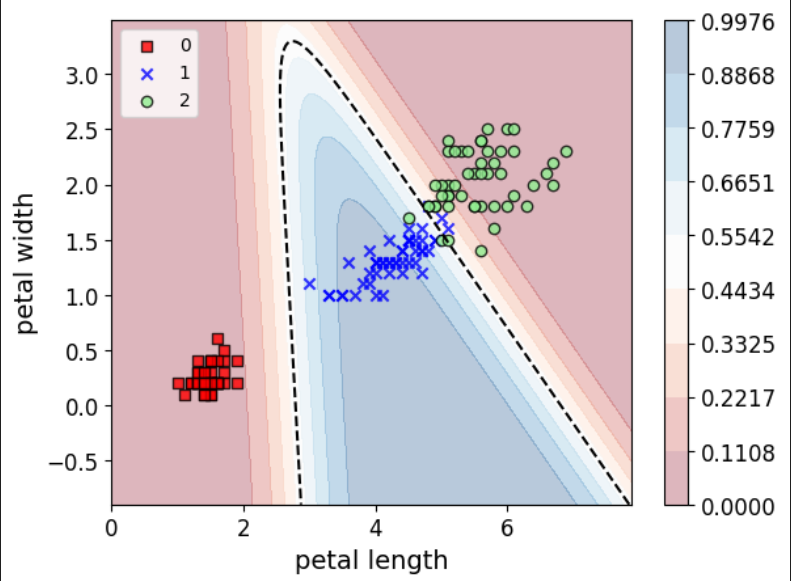
3.2 多分类 简单代码示例:
1 2 3 4 5 6 7 X = iris['data' ][:,(2 ,3 )] y = iris['target' ] softmax__reg = LogisticRegression(multi_class="multinomial" ,solver="lbfgs" ) softmax__reg.fit(x,y) plot_decision_region(x, y, classifier=softmax__reg, resolution=0.01 )
逻辑回归理论以及实操部分到这里基本告一个段落。。。

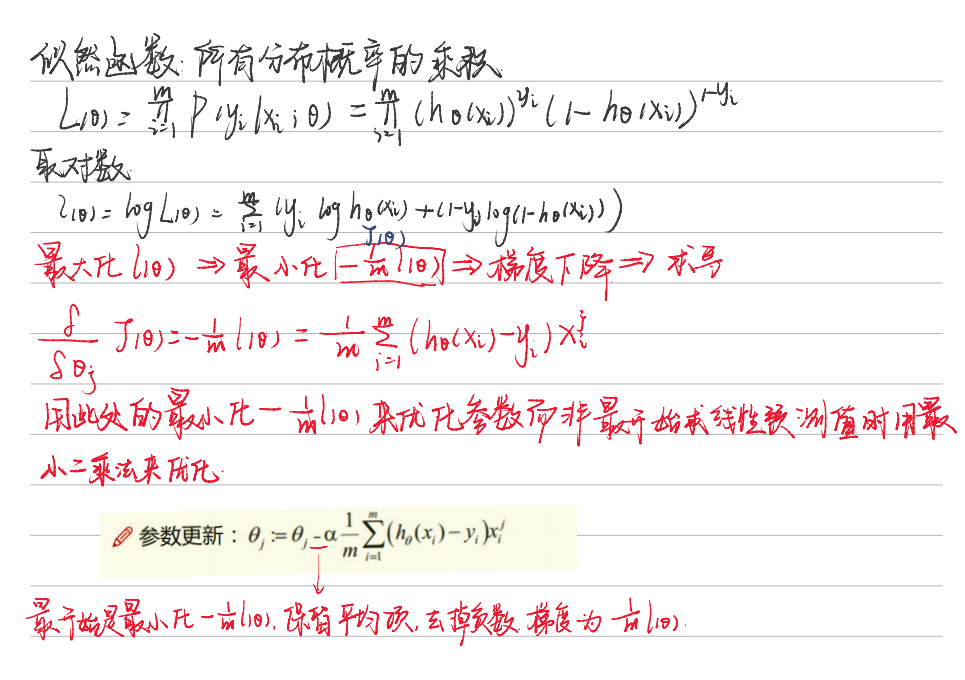
 来最小化
来最小化.png),实际上也可以通过改变参数更新的符号(减改为加)来达到最大化似然函数的目的,这样的方法叫梯度上升

