前言 前面的文章中,我们讲述了用于回归的线性回归算法,用于分类的逻辑回归算法以及其变式softmax函数,其实不管是回归还是分类,都是通过已有的数据集,知道输入和输出结果之间的关系,然后根据这种已知的关系,训练得到一个最优的模型。这样的模式被称为监督学习 。但是在实际生产中,这样既有特征(feature)又有 标签(label)的数据集似乎需要使用特殊设备或经过昂贵且用时非常长的实验过程进行人工标记才能得到。当我们不知道数据集中数据、特征之间的关系,而是要根据聚类或一定的模型才能得到数据之间的关系时,我们称为这样的模式叫做 无监督学习 。在无监督学习中数据只有特征(feature)无标签(label) ,它本质上是一个统计手段,在没有标签的数据里可以发现潜在的一些结构的一种训练方式。
本篇文章我们来讲讲无监督学习中,用于聚类的K_Means算法与DBSCAN算法。
一、聚类和分类 聚类适用于没有明确类别标签的数据(无监督),目的是通过相似性将数据划分为若干个簇,以发现数据的内在结构和分布规律。它不需要预先定义类别,而是根据数据本身的特征自动分组。
分类则适用于有明确类别标签的数据(有监督),目的是根据已有的标签训练模型,对新的数据进行类别预测。它需要有标记的训练数据来学习特征与类别之间的关系,适合用于预测性分析。
简单来说,聚类注重数据之间的相似性关系,通过将相似的数据聚集在一起,发现数据的内在结构;而分类更强调数据特征与预定义标签之间的关系,通过学习特征与标签的映射关系来进行预测。
二、K_Means K-means 的目标是将数据集划分为 反复调整簇中心的位置 ,K-means 不断优化簇内的紧密度 ,从而获得尽量紧凑、彼此分离的簇(高内聚低耦合 )。
2.1 简单工作流程介绍 K_Means的理论部分其实没有过多要介绍的内容,实际上就是一个不断计算距离并更新簇中心的过程,关于距离的度量,我们通常采用欧几里得距离:
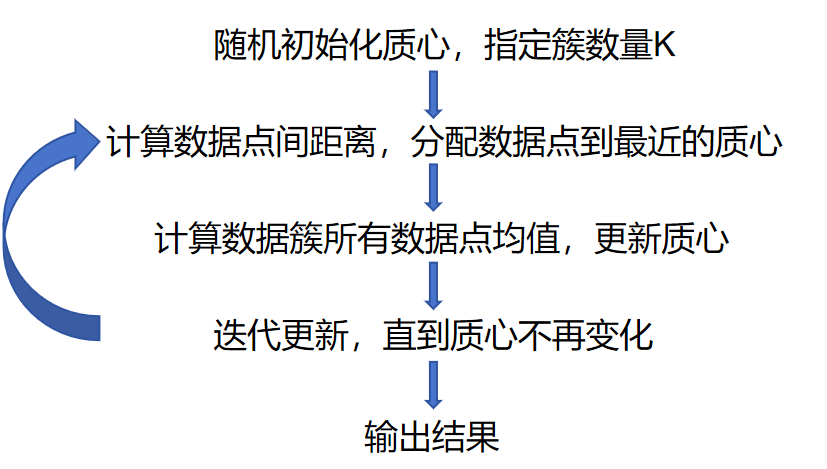
下面是算法工作流程 :
这里介绍一个网站用于K_Means和DBSCAN两种聚类的直观可视化
https://www.naftaliharris.com/blog/visualizing-dbscan-clustering/ https://www.naftaliharris.com/blog/visualizing-dbscan-clustering/
我们选取Picked circles作为案例
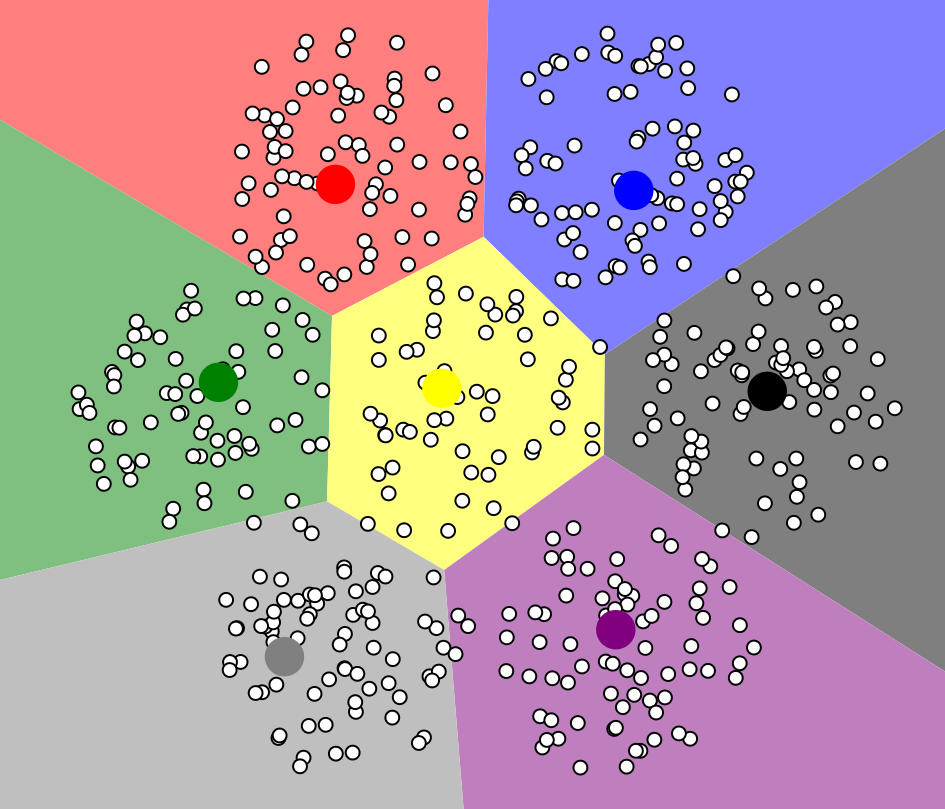
首先指定执行数量,从图上来看,似乎7比较合理,注意,下面的点是我们初始化人为指定的点
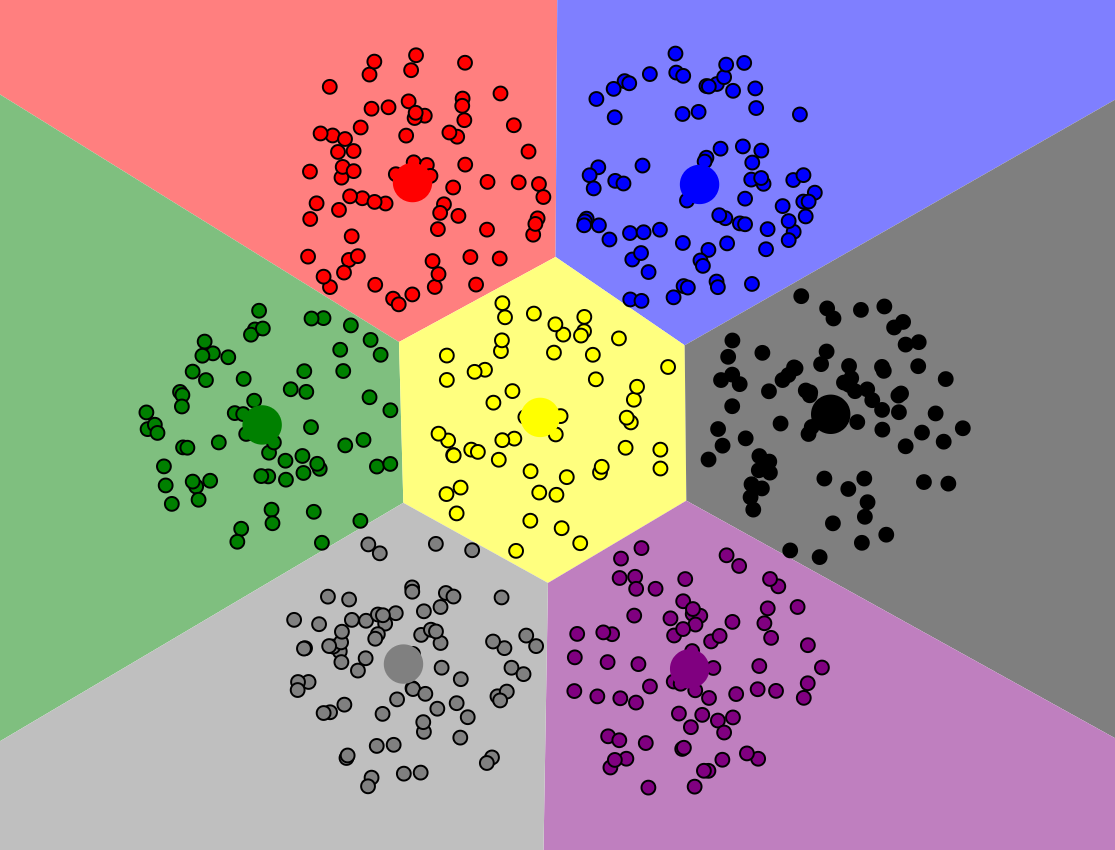
最终经过不断迭代,我们得出聚类结果如下,此时每个簇上的数据点到对应质心的距离之和最小,模型达到稳定
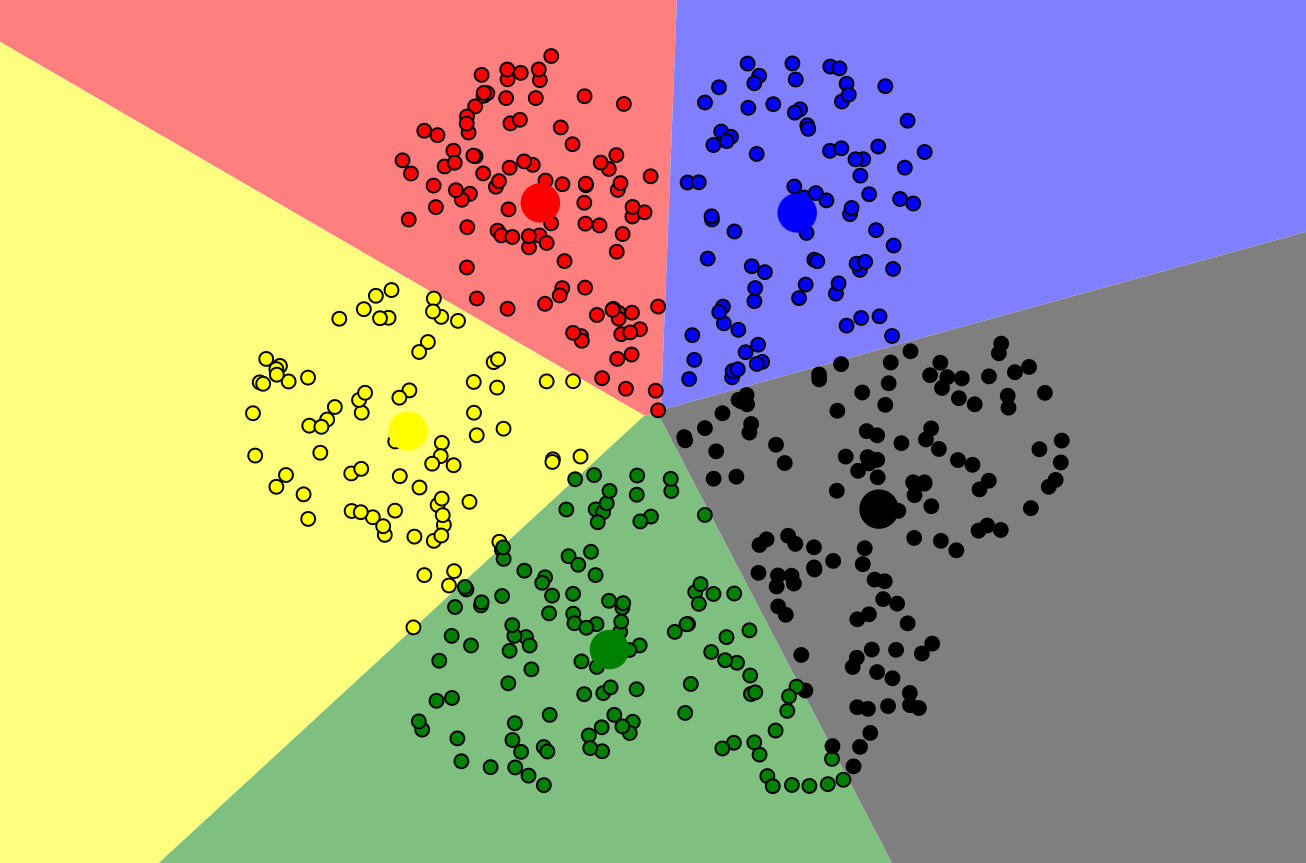
当然,我们也可以选择5个质心来玩一玩,聚类的结果似乎也说得通,**其实聚类结果没有绝对标准解释,**是因为聚类是无监督学习,数据本身缺乏外部标签,且不同聚类算法基于不同原理和假设,对数据分布、特征权重的处理方式各异。关键在于能否对聚类结果自圆其说。
但是注意,对于初始化质心位置的不同,最终的分类结果也会有差异 ,后续我们会继续介绍这一性质。
2.2 sklearn代码复现 详细注释已经在代码中给出了,比较简单,关键是分配样本到最近的质心 和更新每个簇的质心 两个环节,因为没有损失函数 (前面给出的距离并不是损失函数,而是实际的距离,并不需要最小化),自然也不涉及梯度下降 。
1
2
3
4
5
6
7
8
9
10
11
12
13
14
15
16
17
18
19
20
21
22
23
24
25
26
27
28
29
30
31
32
33
34
35
36
37
38
39
40
41
42
43
44
45
46
47
48
49
50
51
52
53
54
55
56
57
58
59
60
61
62
63
64
import numpy as npclass Kmeans : def __init__ (self,data,num_clusters ): self .data = data self .num_clusters = num_clusters @staticmethod def centroids_init (data,num_clusters ): num_examples = data.shape[0 ] random_ids = np.random.permutation(num_examples) centroids = data[random_ids[:num_clusters],:] return centroids @staticmethod def centroids_find_closest (data,centroids ): """ 核心计算公式,用于将每个样本分配到最近的簇,返回值是每个样本对应的质心索引 """ num_examples = data.shape[0 ] num_centroids = centroids.shape[0 ] closest_centroids_ids = np.zeros((num_examples,1 )) for example_index in range (num_examples): distance = np.zeros((num_centroids,1 )) for centroid_index in range (num_centroids): distance_diff = data[example_index,:] - centroids[centroid_index,:] distance[centroid_index] = np.sum (distance_diff**2 ) closest_centroids_ids[example_index] = np.argmin(distance) return closest_centroids_ids @staticmethod def centroids_compute (data,closest_centroids_ids,num_clustres ): num_features = data.shape[1 ] centroids = np.zeros((num_clustres,num_features)) for centroid_id in range (num_clustres): closest_ids = closest_centroids_ids == centroid_id centroids[centroid_id] = np.mean(data[closest_ids.flatten(),:],axis=0 ) return centroids def train (self,max_iterations ): centroids = Kmeans.centroids_init(self .data,self .num_clusters) num_examples = self .data.shape[0 ] closest_centroids_ids = np.empty((num_examples,1 )) for _ in range (max_iterations): closest_centroids_ids = Kmeans.centroids_find_closest(self .data,centroids) centroids = Kmeans.centroids_compute(self .data,closest_centroids_ids,self .num_clusters) return centroids,closest_centroids_ids
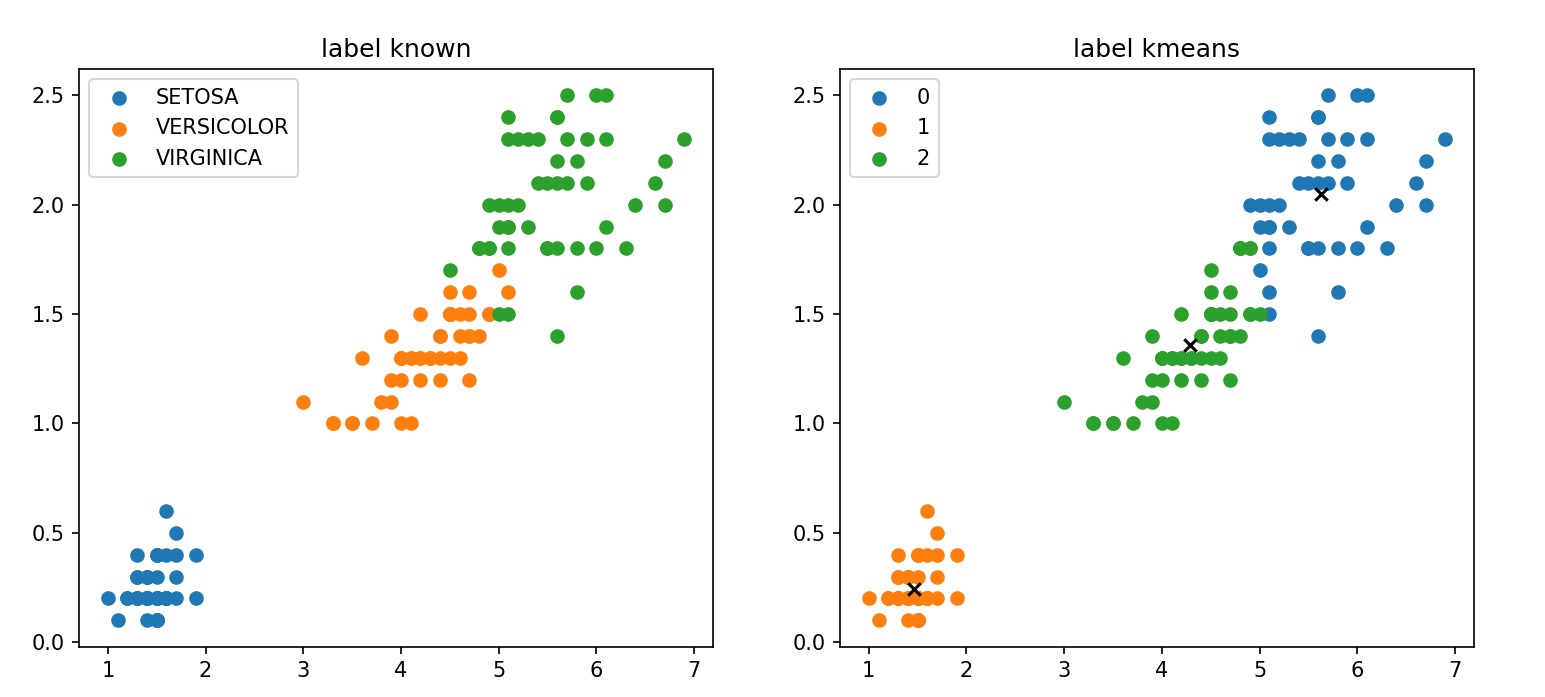
2.3 模型测试 1 2 3 4 5 6 7 8 9 10 11 12 13 14 15 16 17 18 19 20 21 22 23 24 25 26 27 28 29 30 31 32 33 34 35 36 37 38 39 40 41 import numpy as npimport pandas as pdimport matplotlib.pyplot as pltfrom kmeans import Kmeansdata = pd.read_csv(r'D:\桌面\华清\机器学习\西瓜书\k_means聚类\data\iris.csv' ) iris_types = ['SETOSA' ,'VERSICOLOR' ,'VIRGINICA' ] x_axis = 'petal_length' y_axis = 'petal_width' num_examples = data.shape[0 ] x_train = data[[x_axis,y_axis]].values.reshape(num_examples,2 ) num_clusters = 3 max_iterations = 50 k_means = Kmeans(x_train,num_clusters) centroids,closest_centroids_ids = k_means.train(max_iterations) plt.figure(figsize=(12 ,5 )) plt.subplot(1 ,2 ,1 ) for iris_type in iris_types: plt.scatter(data[x_axis][data['class' ]==iris_type],data[y_axis][data['class' ]==iris_type],label = iris_type) plt.title('label known' ) plt.legend() plt.subplot(1 ,2 ,2 ) for centroid_id, centroid in enumerate (centroids): current_examples_index = (closest_centroids_ids == centroid_id).flatten() plt.scatter(data[x_axis][current_examples_index],data[y_axis][current_examples_index],label = centroid_id) for centroid_id, centroid in enumerate (centroids): plt.scatter(centroid[0 ],centroid[1 ],c='black' ,marker = 'x' ) plt.legend() plt.title('label kmeans' ) plt.show()
最后运行实际类别与算法分类结果对比如下图,每种颜色代表一个类别,可以看出相似度还是挺高的
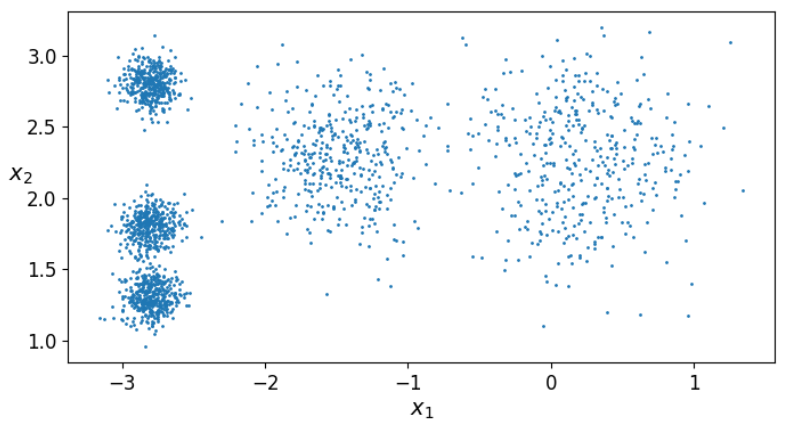
2.4 调用sklearn库函数 我们首先来生成一些随机的数据点用于后续实验
1 2 3 4 5 6 7 8 9 10 11 12 13 14 15 16 17 18 19 20 21 22 23 24 25 26 27 28 29 30 31 32 import numpy as npimport osimport matplotlib.pyplot as pltimport pandas as pdplt.rcParams["axes.labelsize" ] = 14 plt.rcParams["xtick.labelsize" ] = 12 plt.rcParams["ytick.labelsize" ] = 12 import warningswarnings.filterwarnings("ignore" ) np.random.seed(42 ) from sklearn.datasets import make_blobsblob_centers = np.array( [[0.2 ,2.3 ], [-1.5 ,2.3 ], [-2.8 ,1.8 ], [-2.8 ,2.8 ], [-2.8 ,1.3 ]]) blob_std =np.array([0.4 ,0.3 ,0.1 ,0.1 ,0.1 ]) x,y = make_blobs(n_samples=2000 ,centers=blob_centers, cluster_std = blob_std,random_state=7 ) def plot_clusters (x, y=None ): plt.scatter(x[:, 0 ], x[:, 1 ], c=y, s=1 ) plt.xlabel("$x_1$" , fontsize=14 ) plt.ylabel("$x_2$" , fontsize=14 , rotation=0 ) plt.figure(figsize=(8 , 4 )) plot_clusters(x) plt.show()
可视化一下
调用sklearn.cluster中的KMeans对数据进行聚类,这里传入的参数为KMeans(簇数,初始化质心方式,初始化质心坐标,指定运行次数,最大迭代次数,随机种子) ,三个参数都是可选的,这里我们只传入簇数和随机种子,让他自己初始化质心
1 2 3 4 5 from sklearn.cluster import KMeansk = 5 kmeans = KMeans(n_clusters=k,random_state=42 ) y_pred = kmeans.fit_predict(x) y_pred
kmeans.labels_ :y_pred可以显示最终每条数据样本分类的结果,也可以用kmeans.labels_,输出结果一样
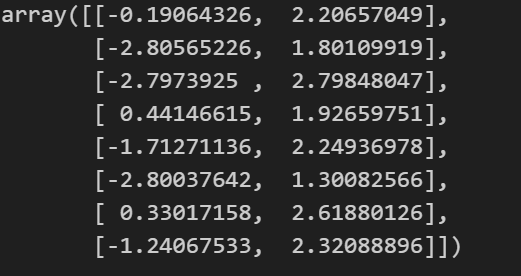
kmeans.cluster_centers_ :得到每个簇的中心点
**kmeans.predict(x_new):**传入新的数据进去进行预测
1 2 x_new = np.array([[0 ,2 ],[3 ,2 ],[-3 ,-3 ],[-3 ,2.5 ]]) kmeans.predict(x_new)
**kmeans.transform(x_new):**计算每一个样本到每一个簇的中心点的距离
1 kmeans.transform(x_new):
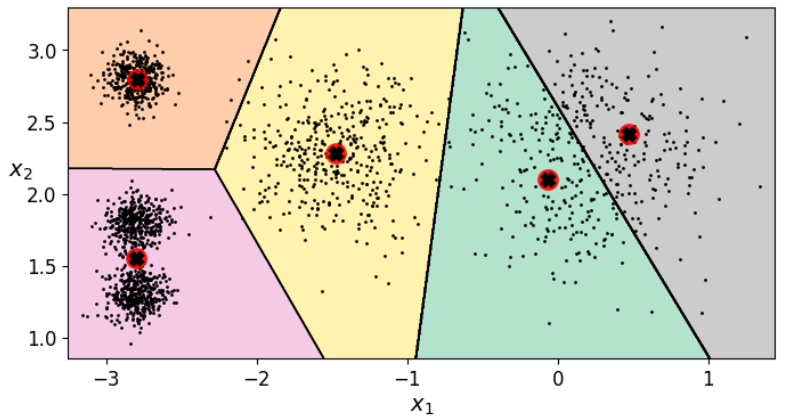
下面绘制决策边界,不用死记硬背代码,知道怎么改参数就行
1 2 3 4 5 6 7 8 9 10 11 12 13 14 15 16 17 18 19 20 21 22 23 24 25 26 27 28 29 30 31 32 33 34 35 36 37 38 39 40 41 42 def plot_data (X ): plt.plot(X[:, 0 ], X[:, 1 ], 'k.' , markersize=2 ) def plot_centroids (centroids, weights=None , circle_color='r' , cross_color='k' ): if weights is not None : centroids = centroids[weights > weights.max () / 10 ] plt.scatter(centroids[:, 0 ], centroids[:, 1 ], marker='o' , s=30 , linewidths=8 , color=circle_color, zorder=10 , alpha=0.9 ) plt.scatter(centroids[:, 0 ], centroids[:, 1 ], marker='x' , s=10 , linewidths=10 , color=cross_color, zorder=11 , alpha=1 ) def plot_decision_boundaries (clusterer, X, resolution=1000 , show_centroids=True , show_xlabels=True , show_ylabels=True ): mins = X.min (axis=0 ) - 0.1 maxs = X.max (axis=0 ) + 0.1 xx, yy = np.meshgrid(np.linspace(mins[0 ], maxs[0 ], resolution), np.linspace(mins[1 ], maxs[1 ], resolution)) Z = clusterer.predict(np.c_[xx.ravel(), yy.ravel()]) Z = Z.reshape(xx.shape) plt.contourf(Z, extent=(mins[0 ], maxs[0 ], mins[1 ], maxs[1 ]), cmap="Pastel2" ) plt.contour(Z, extent=(mins[0 ], maxs[0 ], mins[1 ], maxs[1 ]), linewidths=1 , colors='k' ) plot_data(X) if show_centroids: plot_centroids(clusterer.cluster_centers_) if show_xlabels: plt.xlabel("$x_1$" , fontsize=14 ) else : plt.tick_params(labelbottom='off' ) if show_ylabels: plt.ylabel("$x_2$" , fontsize=14 , rotation=0 ) else : plt.tick_params(labelleft='off' ) plt.figure(figsize=(8 , 4 )) plot_decision_boundaries(kmeans, x) plt.show()
2.5 评估指标 2.5.1 **kmeans.inertia_**函数 评价模型聚类效果通常是计算每个样本到其对应质心的距离之和(簇内误差平方和 ) ,使用**kmeans.inertia_**函数
2.5.2 轮廓系数 轮廓系数综合考虑了簇内紧密度(内聚度)和簇间分离度(分离度) ,能够有效衡量聚类结果的合理性
单个数据点的轮廓系数
对于每个数据点 i,轮廓系数 s(i) 的计算公式为:
a(i) 是样本 i 到其所在簇内其他样本的平均距离 ,反映了簇内的紧密度。
其中 C 是样本 i 所在的簇,∣C∣ 是簇 C 中的样本数量,xi 和 xj 分别是样本 i 和样本 j 的特征向量。
b(i) 是样本 i 到最近的其他簇中所有样本的平均距离 ,反映了簇间的分离度。
其中 C′ 是与 C 不同的簇,∣C′∣ 是簇 C′ 中的样本数量。
si接近1,则说明样本i聚类合理(高类聚低耦合);
si接近-1,则说明样本i更应该分类到另外的簇;
若si 近似为0,则说明样本i在两个簇的边界上。
整个数据集的轮廓系数
整个数据集的轮廓系数是所有数据点轮廓系数的平均值:
代码演示:
进行聚类:
1 2 3 4 5 from sklearn.cluster import KMeansk = 5 kmeans = KMeans(n_clusters=k,random_state=42 ) y_pred = kmeans.fit_predict(x) kmeans.labels_
计算轮廓系数:
1 2 from sklearn.metrics import silhouette_scoresilhouette_score(x, kmeans.labels_)
2.6 找到最佳簇数K 在介绍之前首先要说明一点,这里所说的最佳簇数只是一个参考值,原因前面已经介绍过了。
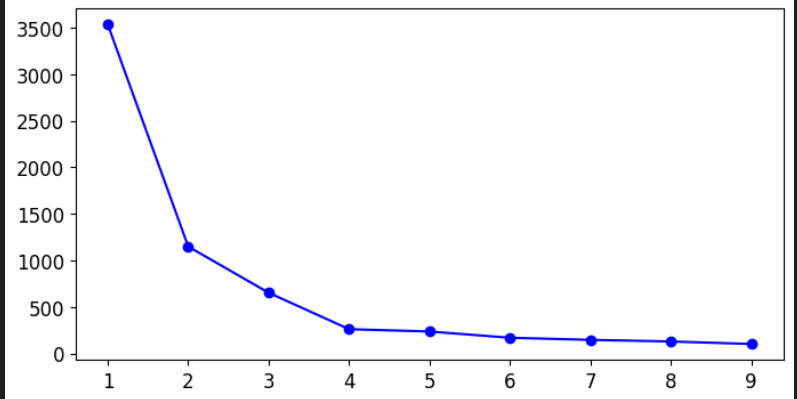
2.6.1 肘部法则 这是基于kmeans.inertia_函数的法则,其核心思想是通过计算不同 K 值下的 簇内误差平方和 ,绘制 K 值与 SSE 的关系曲线,寻找曲线的“拐点”(形似肘部),即增加 K 值带来的 SSE 下降幅度开始显著减小的点。
1 2 3 4 5 6 7 8 kmeans_per_k = [KMeans(n_clusters = k).fit(x) for k in range (1 ,10 )] inertias = [model.inertia_ for model in kmeans_per_k] plt.figure(figsize=(8 ,4 )) plt.plot(range (1 ,10 ),inertias,'bo-' ) plt.show()
似乎拐点在4处,因此可以把簇数K设置为4
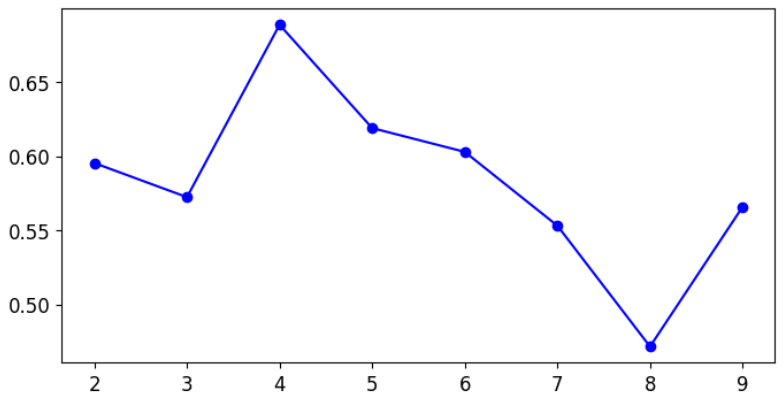
2.6.1 轮廓系数法 核心思想和肘部法则类似,都是通过不同簇数来对比产生比较好的那个K
1 2 3 4 5 6 7 8 9 kmeans_per_k = [KMeans(n_clusters = k).fit(x) for k in range (2 ,10 )] silhouette_scores = [silhouette_score(x,model.labels_) for model in kmeans_per_k] silhouette_scores plt.figure(figsize=(8 ,4 )) plt.plot(range (2 ,10 ),silhouette_scores,'bo-' ) plt.show()
似乎好像还是4。。 。
2.7 劣势 除了K值,前面说到初始质心的设置也会对结果产生比较大的影响,下面我们来进行实验看看是不是这样
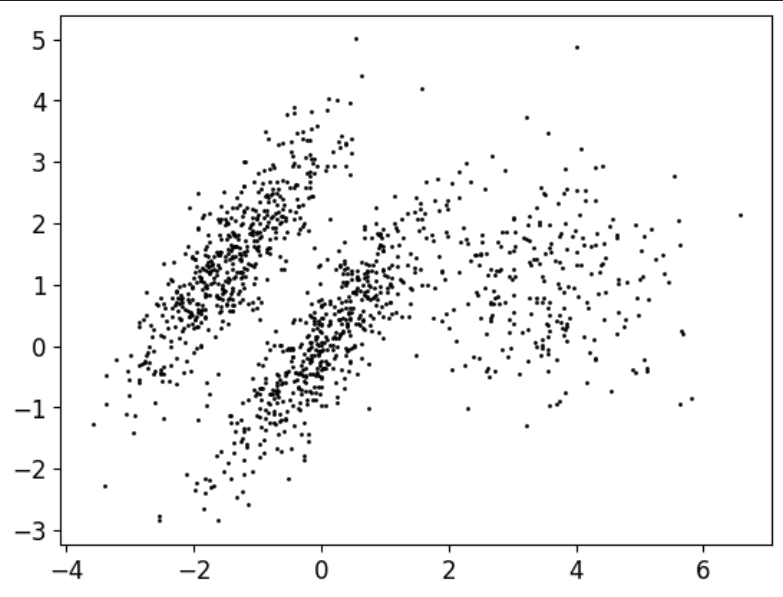
首先生成一个边界没有那么清晰的数据
1 2 3 4 5 6 7 8 9 X1, y1 = make_blobs(n_samples=1000 , centers=((4 , -4 ), (0 , 0 )), random_state=42 ) X1 = X1.dot(np.array([[0.374 , 0.95 ], [0.732 , 0.598 ]])) X2, y2 = make_blobs(n_samples=250 , centers=1 , random_state=42 ) X2 = X2 + [6 , -8 ] X = np.r_[X1, X2] y = np.r_[y1, y2] plot_data(X)
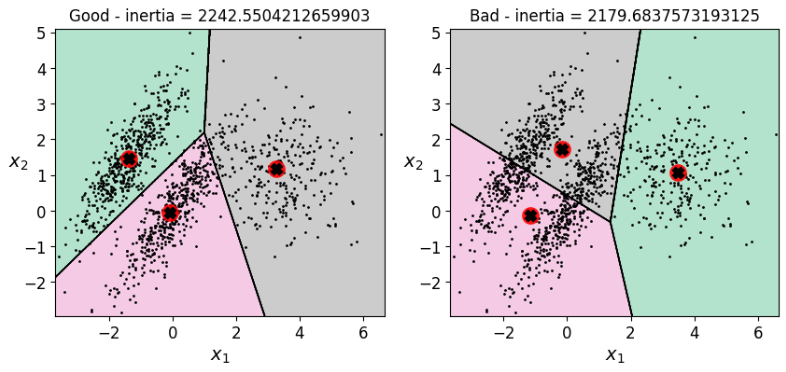
选取不同质心进行聚类 ,并绘制决策边界可视化聚类结果
1 2 3 4 5 6 7 8 9 10 11 12 13 14 15 16 kmeans_good = KMeans(n_clusters=3 ,init=np.array([[-1.5 ,2.5 ],[0.5 ,0 ],[4 ,0 ]]),n_init=1 ,random_state=42 ) kmeans_bad = KMeans(n_clusters=3 ,random_state=15 ) kmeans_good.fit(X) kmeans_bad.fit(X) plt.figure(figsize = (10 ,4 )) plt.subplot(121 ) plot_decision_boundaries(kmeans_good,X) plt.title('Good - inertia = {}' .format (kmeans_good.inertia_)) plt.subplot(122 ) plot_decision_boundaries(kmeans_bad,X) plt.title('Bad - inertia = {}' .format (kmeans_bad.inertia_)) plt.show()
似乎第二种聚类效果还好些,但是直观来看第一种要更好解释一些。。
2.8 图像分割 K-Means算法还可以用于图像分割,将图像中的像素根据其特征(如颜色、位置等)划分为不同的簇,从而实现对图像的区域划分。图像分割 的目标是将图像划分为若干具有相似特征的区域 ,而K-Means 算法通过聚类的方式,将相似的像素分配到同一个簇中 ,簇的数量K可以根据需要设置,每个簇对应图像中的一个分割区域。
首先我们读入一张图片
1 2 3 4 5 6 7 import cv2 as cvimg = cv.imread("girl.png" ) img_ = img.copy() cv.imshow("img" ,img) cv.waitKey(0 ) cv.destroyAllWindows()
由于图片像素是三维,不符合KMeans的输入,因此要将三维数据转换成二维
1 2 x = img_.reshape(-1 ,3 ) x.shape
现在我们相当于有了一个有108514个样本,三个特征的数据,下面我们来进行聚类,并将聚类后的数组形状更改到与原数组一样
1 2 3 4 5 6 7 8 kmeans = KMeans(n_clusters=8 ,random_state=42 ).fit(x) segmented_imgs = [] n_colors = (i for i in range (2 , 10 )) for n_cluster in n_colors: kmeans = KMeans(n_clusters=n_cluster, random_state=42 ).fit(x) segmented_img = kmeans.cluster_centers_[kmeans.labels_] segmented_imgs.append(segmented_img.reshape(img.shape))
遍历列表,一一显示聚类后的新图像
1 2 3 4 5 6 7 8 9 10 11 12 13 14 15 16 17 18 19 20 21 22 23 24 25 26 27 28 max_height = max (img.shape[0 ] for img in segmented_imgs) max_width = max (img.shape[1 ] for img in segmented_imgs) resized_imgs = [] for img in segmented_imgs: resized_img = cv.resize(img, (max_width, max_height), interpolation=cv.INTER_AREA) resized_imgs.append(resized_img) combined_img = cv.hconcat(resized_imgs) window_name = "Segmented Images" cv.namedWindow(window_name, cv.WINDOW_NORMAL) cv.imshow(window_name, combined_img.astype(np.uint8)) cv.waitKey(0 ) cv.destroyAllWindows()
最终结果,将图片从2到10进行聚类:
三、DBSCN算法 算法原理可谓是相当简单粗暴,DBSCAN 使用两个关键参数:
eps(ε)minPts
算法通过设定eps(点间最大距离)和minPts(最小点数)来识别核心点,并从核心点开始递归扩展簇,同时标记边界点和噪声点,最终根据密度关系自动完成聚类,类似于“发展下线 ”。
先生成一些数据:
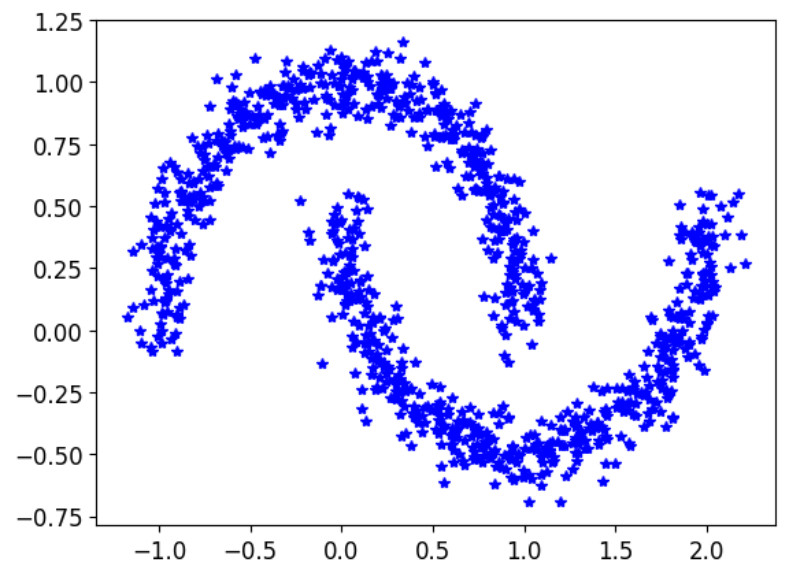
1 2 3 4 5 from sklearn.datasets import make_moonsx, y = make_moons(n_samples=1000 , noise=0.08 , random_state=42 ) plt.plot(x[:,0 ],x[:,1 ],'b*' ) plt.show()
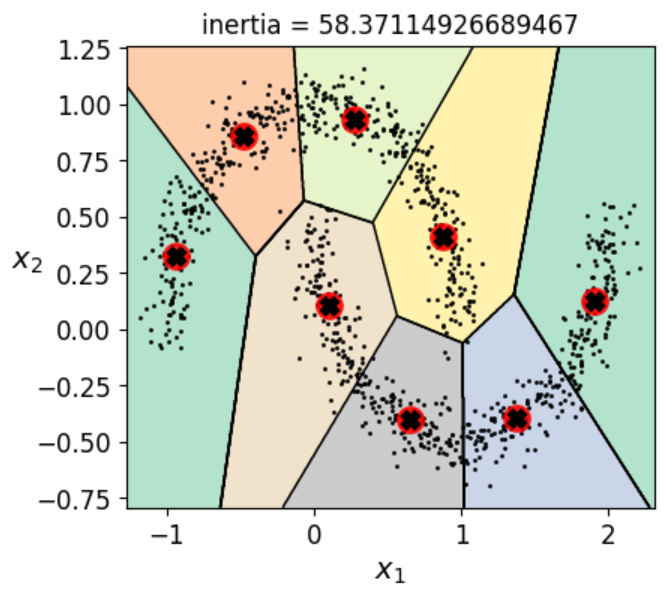
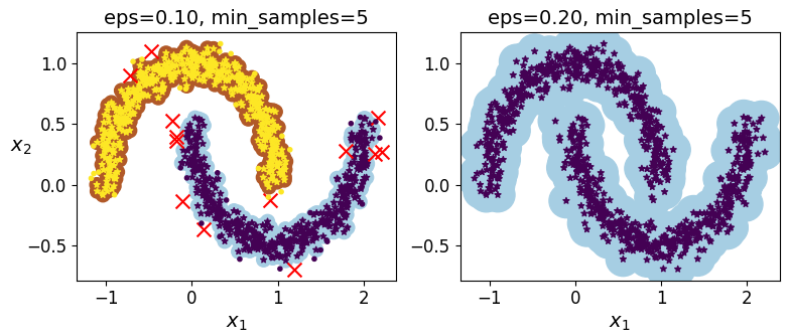
可以看到,这样的数据对KMeans来讲肯定是没法很好地聚出来的,KMeans只看重距离,对簇的形状没有办法识别,而DBSCN可以很好的解决这个问题
我们首先来看看KMeans聚出来的结果
然后对比一下DBSCN算法
1 2 3 4 5 6 7 8 9 10 11 12 13 14 15 16 17 18 19 20 21 22 23 24 25 26 27 28 29 30 31 32 33 34 35 36 37 38 39 40 41 42 43 from sklearn.cluster import DBSCANdbscan = DBSCAN(eps = 0.1 ,min_samples=5 ) dbscan.fit(x) dbscan2 = DBSCAN(eps = 0.2 ,min_samples=5 ) dbscan2.fit(x) def plot_dbscan (dbscan, X, size, show_xlabels=True , show_ylabels=True ): core_mask = np.zeros_like(dbscan.labels_, dtype=bool ) core_mask[dbscan.core_sample_indices_] = True anomalies_mask = dbscan.labels_ == -1 non_core_mask = ~(core_mask | anomalies_mask) cores = dbscan.components_ anomalies = X[anomalies_mask] non_cores = X[non_core_mask] plt.scatter(cores[:, 0 ], cores[:, 1 ], c=dbscan.labels_[core_mask], marker='o' , s=size, cmap="Paired" ) plt.scatter(cores[:, 0 ], cores[:, 1 ], marker='*' , s=20 , c=dbscan.labels_[core_mask]) plt.scatter(anomalies[:, 0 ], anomalies[:, 1 ], c="r" , marker="x" , s=100 ) plt.scatter(non_cores[:, 0 ], non_cores[:, 1 ], c=dbscan.labels_[non_core_mask], marker="." ) if show_xlabels: plt.xlabel("$x_1$" , fontsize=14 ) else : plt.tick_params(labelbottom='off' ) if show_ylabels: plt.ylabel("$x_2$" , fontsize=14 , rotation=0 ) else : plt.tick_params(labelleft='off' ) plt.title("eps={:.2f}, min_samples={}" .format (dbscan.eps, dbscan.min_samples), fontsize=14 ) plt.figure(figsize=(9 , 3.2 )) plt.subplot(121 ) plot_dbscan(dbscan, x, size=100 ) plt.subplot(122 ) plot_dbscan(dbscan2, x, size=600 , show_ylabels=False ) plt.show()
到这里机器学习聚类的内容就差不多结束了,后续如果有补充会再添加。。。
 个簇(clusters,表示数据点集合),使得每个数据点属于距离最近的簇中心(所有点的平均值)。通过反复调整簇中心的位置,K-means 不断优化簇内的紧密度,从而获得尽量紧凑、彼此分离的簇(高内聚低耦合)。
%5E2%7D.png)
![]() https://www.naftaliharris.com/blog/visualizing-dbscan-clustering/
https://www.naftaliharris.com/blog/visualizing-dbscan-clustering/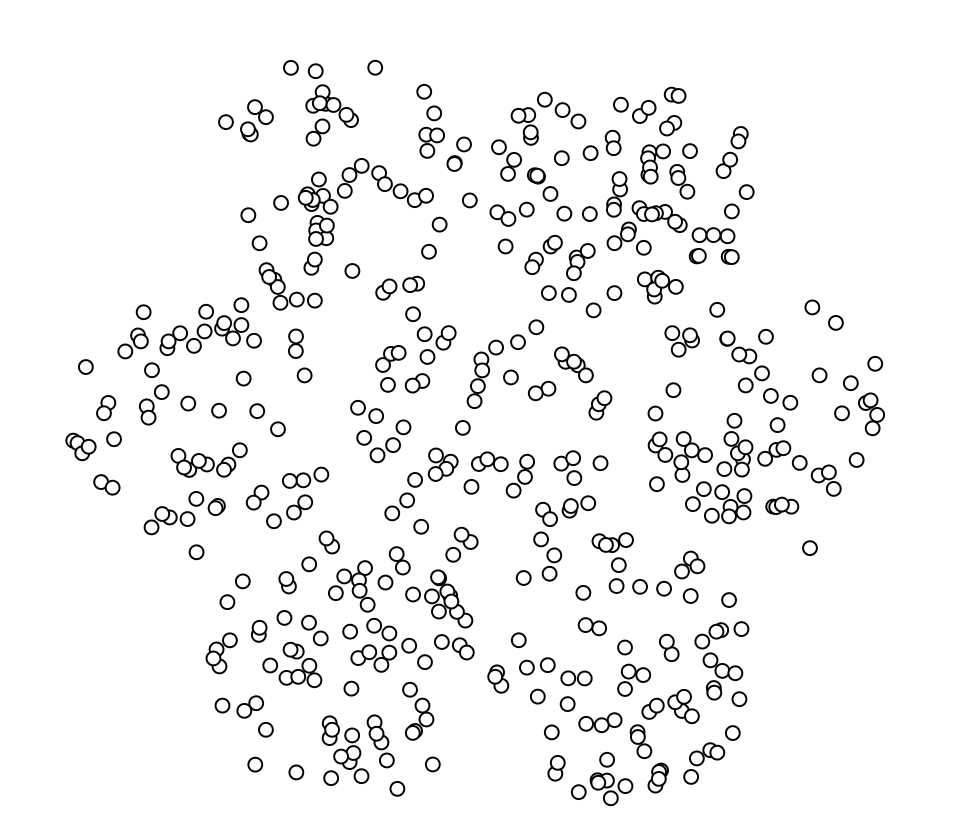




,%20b(i))%7D.png)

.png)
.png)


